The eerie thing you’ll notice once-and never unsee
Open a spreadsheet full of “real” numbers: invoice totals, electricity usage, street addresses? (No-addresses are assigned.) Try again: transaction amounts, stock volumes, river lengths, city populations, file sizes, or scientific measurements. Now cover everything except the first digit of each number.
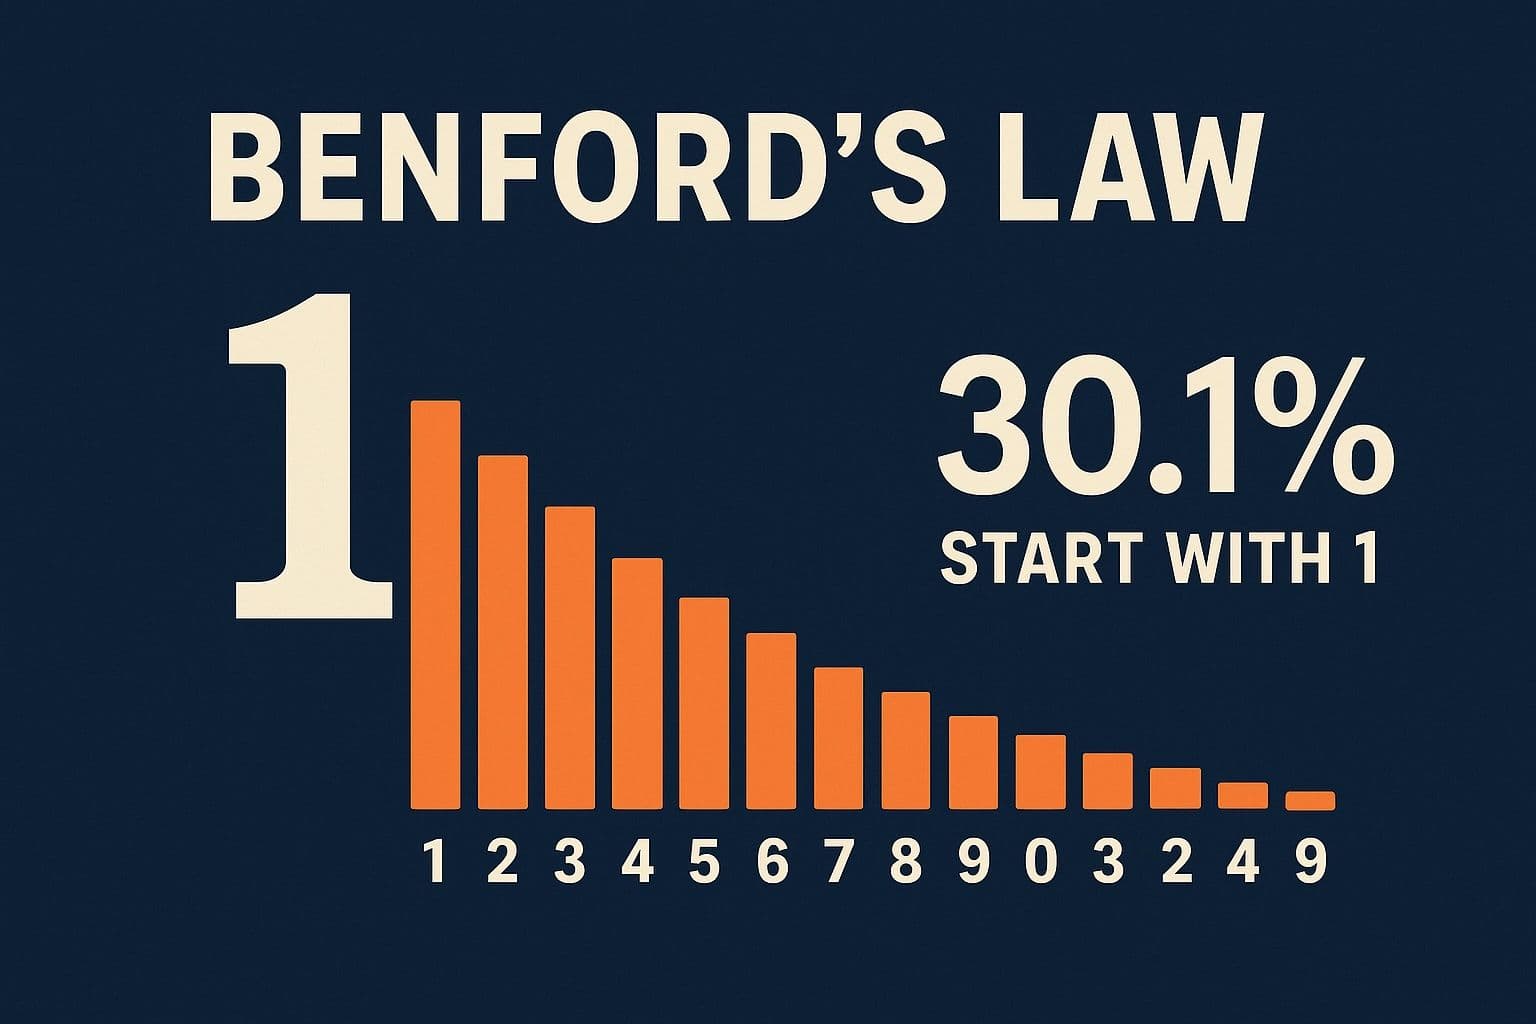
Most people expect the leading digits 1 through 9 to appear roughly equally often. If the world were “fair,” 1 should show up about 11.1% of the time, same as 9.
But in many naturally occurring datasets, that expectation gets demolished:
- 1 appears roughly 30% of the time
- 9 appears roughly 4–5% of the time
That’s not a tiny bias. It’s a landslide.
This pattern is called Benford’s law, and it’s famous for two reasons:
It’s genuinely surprising (a perfect blog topic).
It’s useful-because when people fake numbers, they often fake them wrong, and Benford’s law can help highlight that.
Let’s explore why the universe seems to “prefer” 1s, and how that preference becomes a tool for detecting suspicious data.
The law in one line
Benford’s law predicts the probability that the first digit is (where ):
.
Plug in a few values:
- → 30.1%
- → 17.6%
- → 4.6%
So, in a Benford-like dataset, 1 is about 6–7 times more likely than 9 to be the first digit.
It’s simple to state, weird to believe, and remarkably robust.
The origin story: worn-out pages in log tables
Before calculators, engineers and scientists used logarithm tables. In the late 1800s, astronomer Simon Newcomb noticed something odd: the early pages of these tables-numbers beginning with 1-were much more worn than later pages.
People weren’t randomly consulting logs; they were consulting logs of numbers starting with 1 far more often.
Later, physicist Frank Benford (1938) tested the idea across a pile of datasets-river lengths, populations, scientific constants, and more-and found the same pattern again and again. The “first digit bias” was real, measurable, and predictable.
Why does this happen? The intuition that makes it click
Intuition #1: “First digit” is a logarithmic question, not a linear one
On a normal number line, the interval from 1 to 2 has length 1, and 9 to 10 also has length 1. If you’re thinking linearly, it feels like digits should be balanced.
But first digits don’t care about equal differences. They care about equal ratios.
- From 1 to 2 is multiplying by 2
- From 9 to 10 is multiplying by 1.111…
A dataset that spreads across many sizes (tens, hundreds, thousands, millions) behaves more naturally on a log scale, where equal distances correspond to equal ratios.
Now look at one “decade” of numbers: 1 to 10. The first digit is determined by which interval you land in:
- First digit is 1 if you’re in [1,2]
- First digit is 2 if you’re in [2,3]
- …
- First digit is 9 if you’re in [9,10]
On a log scale, the “width” of each interval is:
.
Those widths are not equal. And the first one is the biggest.
That’s why Benford’s formula is literally:
.
So “1 happens most” because the region of “numbers that start with 1” is the largest in log space.
Intuition #2: Real-world growth is often multiplicative (percent changes)
Many processes evolve by multiplying, not adding:
- A population grows by a percentage
- An investment compounds
- File sizes scale with resolution
- Prices and sales fluctuate proportionally
If a quantity behaves like
Then taking logs gives
.
So the log turns multiplicative growth into additive steps. After many steps, the fractional part of tends to become well-mixed-roughly spread across [0,1]. That “uniform fractional log” condition is a classic route to Benford’s law.
In plain words: when numbers drift across multiple orders of magnitude through percentage-like changes, Benford appears.
A quick reality check: when does Benford actually show up?
Benford’s law is not “all numbers everywhere.” It’s “many natural datasets with the right structure.”
It tends to work well when:
- The dataset spans several powers of 10 (e.g., 1 to 10,000 or more)
- Values come from mixing processes (different sources, different scales)
- Values are not artificially capped or assigned
- The numbers represent measurements or amounts, not labels
Examples that often fit:
- city populations (across many cities)
- river lengths
- stock trading volumes
- electricity consumption
- financial transactions (depending on context)
- scientific measurements compiled broadly
Examples that usually do not fit:
- prices ending in .99 (human pricing habits)
- assigned IDs (invoice numbers, phone numbers, postal codes)
- datasets with built-in minimums/maximums (e.g., test scores 0-100)
- heights of adults (too narrow a range)
- numbers chosen by humans under constraints (“pick a number from 1-1000”)
Benford is a pattern of scale and variety, not a magic stamp of authenticity.
The fraud angle: why fake data often fails Benford’s test
Here’s the human problem: when people fabricate numbers, they tend to overuse “randomness” in a way that looks uniform.
If you asked someone to invent 500 “realistic” transaction amounts quickly, many would unconsciously spread leading digits too evenly-too many 7s, 8s, 9s; not enough 1s.
Benford’s law gives auditors a cheap first-pass screen:
- Compute the leading-digit distribution
- Compare it to Benford’s expected distribution
- Flag datasets with unusually large deviations for deeper review
This is important: Benford doesn’t prove fraud.
It highlights anomalies-places where you should ask, “Why does this dataset behave differently?”
And that’s already valuable.
How you actually apply Benford’s law (in practice)
Let’s say you have a dataset of positive numbers: , , , .
Step 1: Extract the first digit
For each , take the first non-zero digit (ignore signs, ignore decimals).
Example:
- 0.00421 → first digit is 4
- 1200 → first digit is 1
- 98.6 → first digit is 9
Step 2: Count frequencies
Compute the observed proportion for each digit .
Step 3: Compare to Benford expectations
Expected proportion:
.
Step 4: Measure deviation
Common options:
- a simple visual bar chart (often the best first step)
- a chi-square goodness-of-fit test
- mean absolute deviation (MAD), which is popular in auditing contexts
A classic chi-square statistic is:
.
Large deviation doesn’t automatically mean fraud-it can also mean:
- The dataset is too small
- The data are constrained
- The data represent a narrow range
- There is a systematic pricing or rounding structure
So Benford is a smoke detector, not a courtroom verdict.
The “gotchas”: ways honest data can fail Benford
Benford can be fooled-both accidentally and intentionally.
Honest reasons for failure
- Too narrow a range: if all numbers are between 500 and 800, the first digits cluster around 5-8.
- Threshold effects: policies like “anything above 10,000 requires approval” can distort leading digits near 1.
- Psychological pricing: lots of 9s at the end, or standardized price tiers.
- Minimum/maximum constraints: capped values destroy the multi-scale property.
- Sampling bias: a dataset representing only one category (e.g., only “small” invoices) might not span decades.
Dishonest reasons (people learning the trick)
If someone knows Benford’s law and fabricates numbers accordingly, they can make the leading digits look Benford-like.
That’s why real audits use Benford as one tool among many:
- second-digit tests
- last-digit tests (humans overuse 0 and 5)
- time-series patterns
- cross-account consistency checks
- vendor/customer network analysis
- anomaly detection models
Benford is powerful-but it’s not invincible.
A satisfying way to think about it
Benford’s law is less like “nature loves the digit 1” and more like:
If your data don’t have a natural scale, the leading digits become predictable.
Datasets that are scale-free or scale-mixed (spanning orders of magnitude without a preferred unit) tend to drift into Benford’s pattern.
That’s also why Benford is scale invariant in a practical sense: switching units (miles to kilometers, dollars to euros) often doesn’t destroy the leading-digit distribution, because multiplication by a constant shifts logs but doesn’t scramble the underlying structure.
It’s one of those rare results that feels like a coincidence until you realize it’s a consequence of deep symmetry: the symmetry of scale.
Try this at home
If you have a spreadsheet lying around, try Benford on something “natural”:
- a list of transaction amounts (not IDs)
- product sales quantities across many categories
- population of cities in multiple countries
- file sizes in a large folder (not just one file type)
Then try it on something “artificial”:
- employee ID numbers
- exam scores out of 100
- prices from a store using .99 endings
The contrast is the lesson. Benford isn’t about math being spooky-it’s about math revealing which datasets behave like the messy real world, and which ones don’t.
Closing: a law that feels like cheating-until you understand it
Benford’s law is a perfect “math blog” phenomenon: it’s simple enough to state in one line, surprising enough to share, and practical enough to matter.
And it’s a reminder that patterns often live in places we rarely look. Not in the big numbers, not in the averages, but in the humble first digit-quietly whispering whether a dataset has the fingerprints of natural growth… or the fingerprints of someone trying too hard to look random.